Heisenberg
2024 年 12 月 30 日
An AI search engine for brand research inspired by Perplexity
Built by wanghaisheng | Last updated: 20241230
6 seconds read
Project Genesis
From Idea to Implementation
Under the Hood
Lessons from the Trenches
What’s Next?
Project Development Analytics
timeline gant
Commit timelinegant
Commit Activity Heatmap
This heatmap shows the distribution of commits over the past year:
Commit Heatmap
Contributor Network
This network diagram shows how different contributors interact:

Contributor Network
Commit Activity Patterns
This chart shows when commits typically happen:
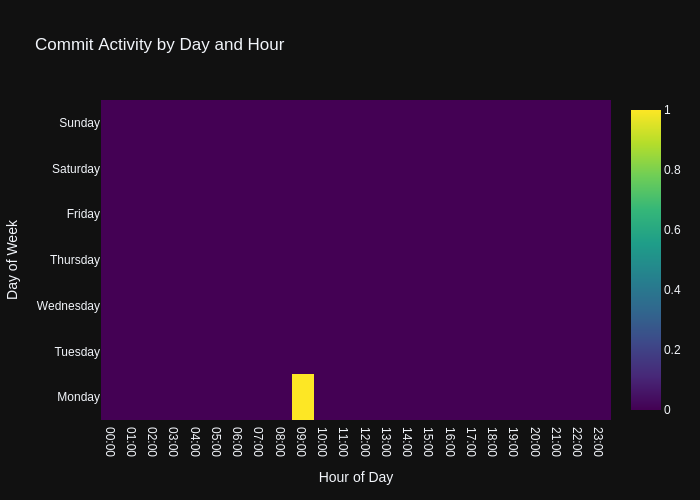
Commit Activity
Code Frequency
This chart shows the frequency of code changes over time:
Code Frequency
- Repository URL: https://github.com/wanghaisheng/brand-genius
- Stars: 0
- Forks: 0
编辑整理: Heisenberg 更新日期:2024 年 12 月 30 日